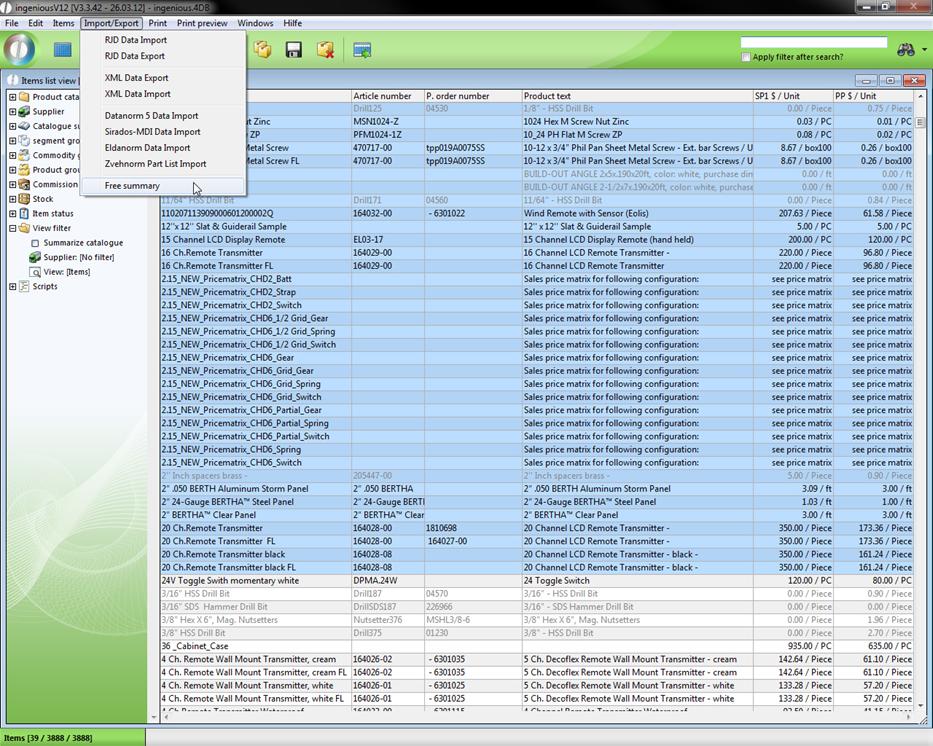
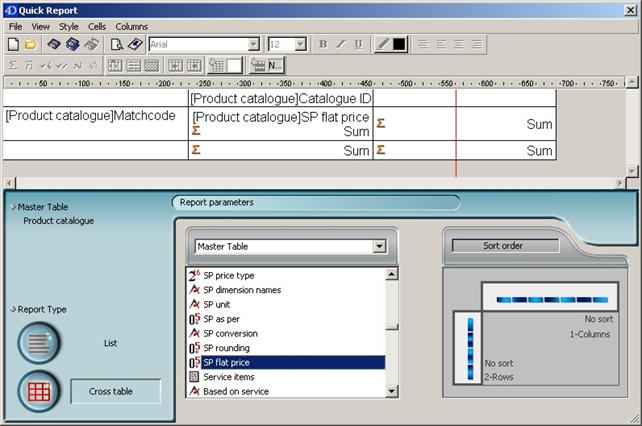
Ingenious.V12 offers a variety of predefined print reports. Without much effort even individual reports can be assembled. With the quick report editor, desired data can be selected and exported to HTML for further processing, filing or printout. You reach the quick report editor in the “Items” module through the menu entries: “Import/Export - Free reports” or in the “Contacts” module via the menu item “Contact - free reports”. The quick report editor offers many more possibilities to display modified or formatted data.
“The first impression counts!” This expression also applies to reports. That is why the quick report editor is equipped with numerous formatting possibilities.
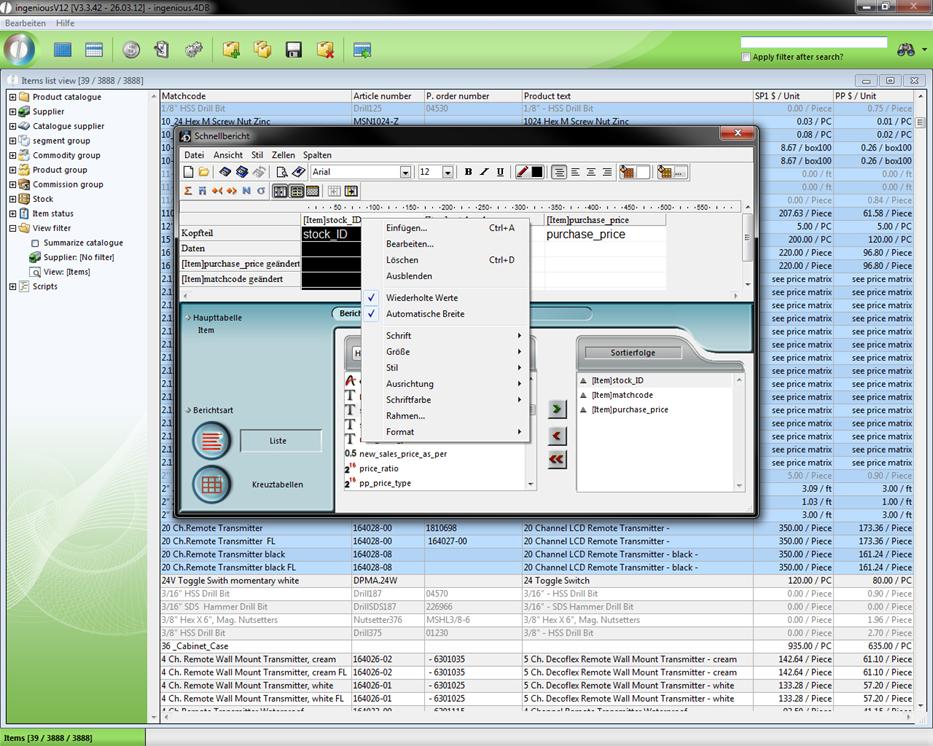
The context menus
Normally, menus open when one clicks on a menu item. With context menus it is different because they open on the current position of the cursor when clicking on the right mouse key and when there is a context menu present. There are three different context menus in the quick report editor: One for the column, one for the line and one for the cell.
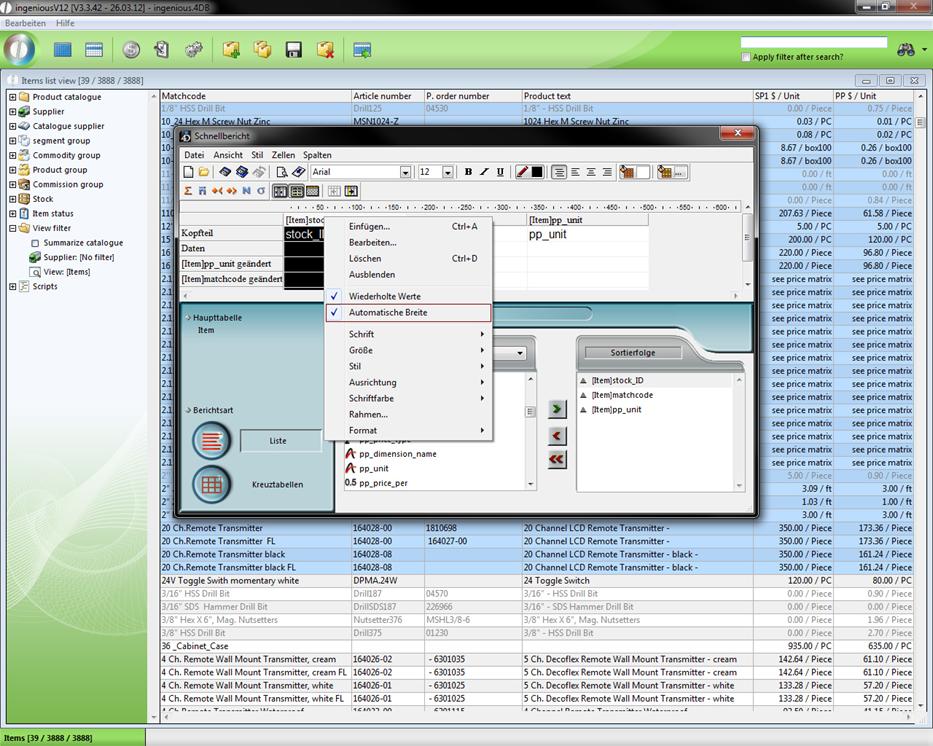
With the column context menu, you can enter columns, edit, delete or display them. With the “Edit…” context menu command you open the formula editor in which you have the possibility to enter your own formulas in the columns. Should you need a column only for sorting and do not want it published in a printout, you can hide it. The hidden column will be marked in a gray diamond grid. The entry “Repeated values” prevents the multiple display of a term in the same column.
Repeated values out
Repeated values in
In order to not have to determine the width of a column yourself, there is an “Automatic width” command. With that, the width of the column will be adjusted to the “widest” entry of the column. The remaining entries of the column context menu concern the lay-out of the column and should be familiar to you.
The line context menu has almost the same graphical possibilities:, just as the column menu and the module context menu “Font”, “Size”, “Style”, “Justification”, “Font color”, “Borders” and “Format”. Lines also can be hidden with the “Hide” command. In order to edit formulas with the formula editor, you must click here on the “Add…” context entry.
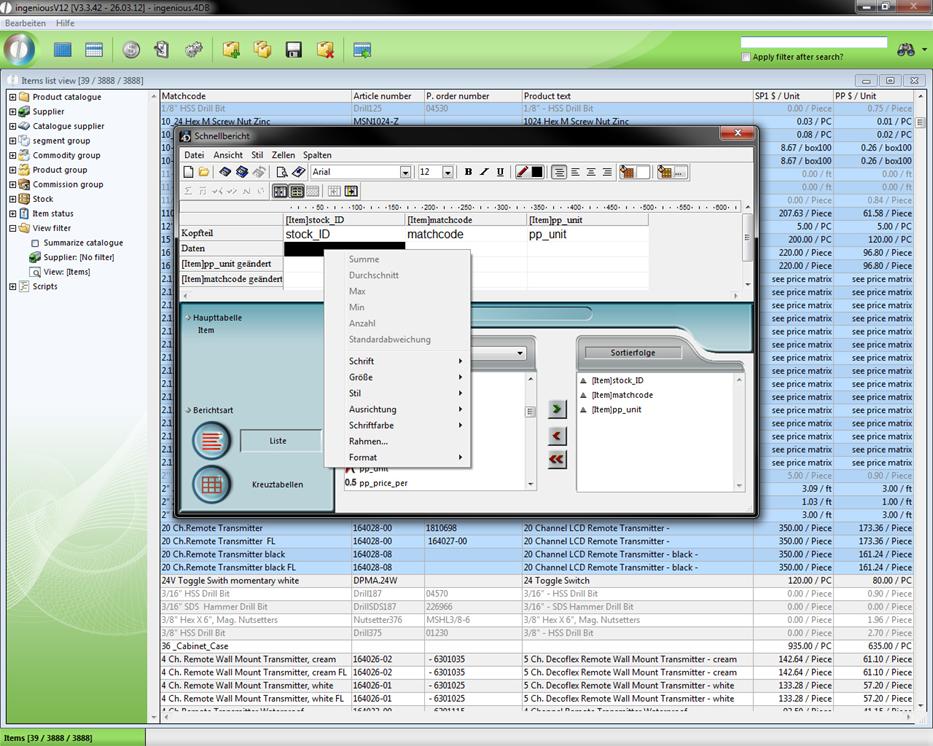
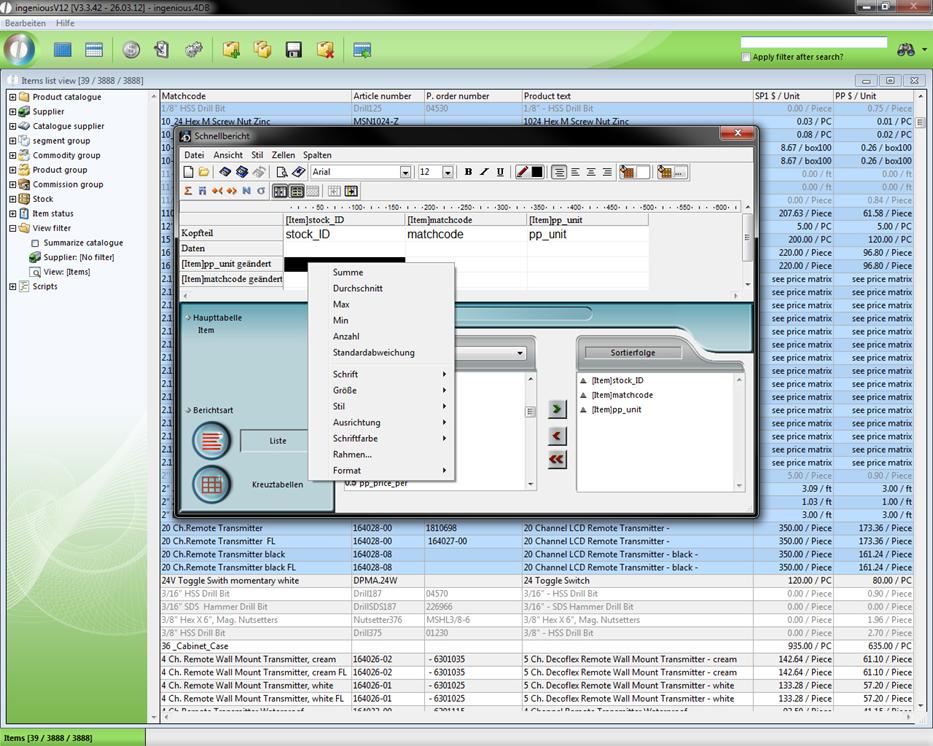
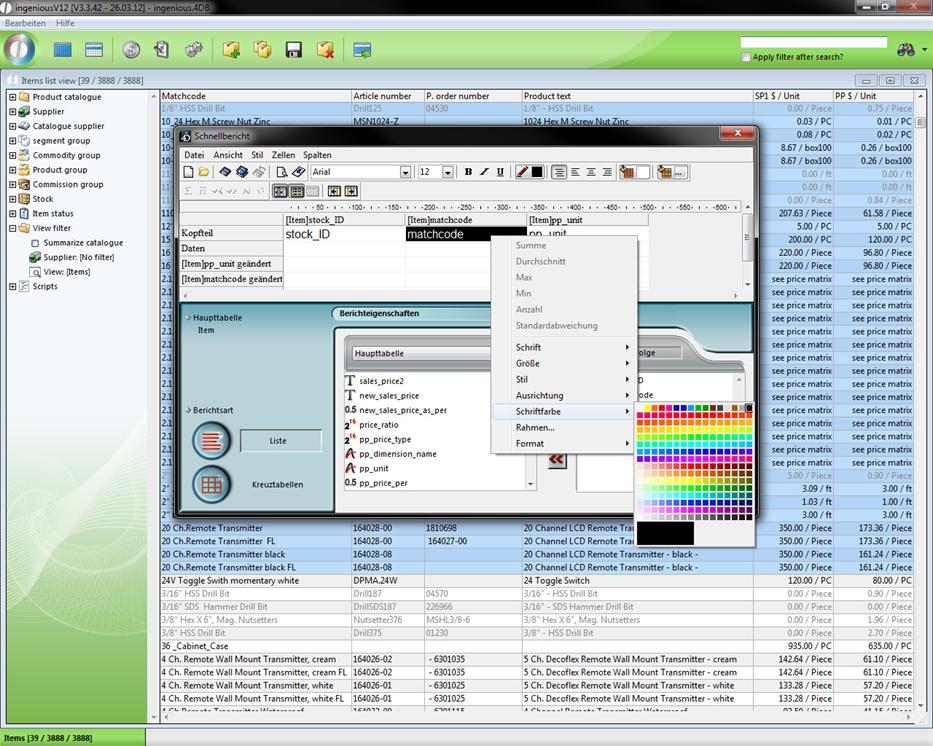
Next to the layout-effected entries, the cell context menu only offers the standard calculations: “Sum”, “Average”, “Max”, “Min” and “ Number” as new options. By clicking on one of these entries, the cell determines the respective value of the vertical and horizontal cells, and then returns it.
The Header and Footer
You can edit the header and footer of the quick report with the menu entry “File / Header and Footer”. Here you can insert and adjust image files. In addition, you have the possibility to show the current time, date and the page number. The font and font style are also individually adjustable.
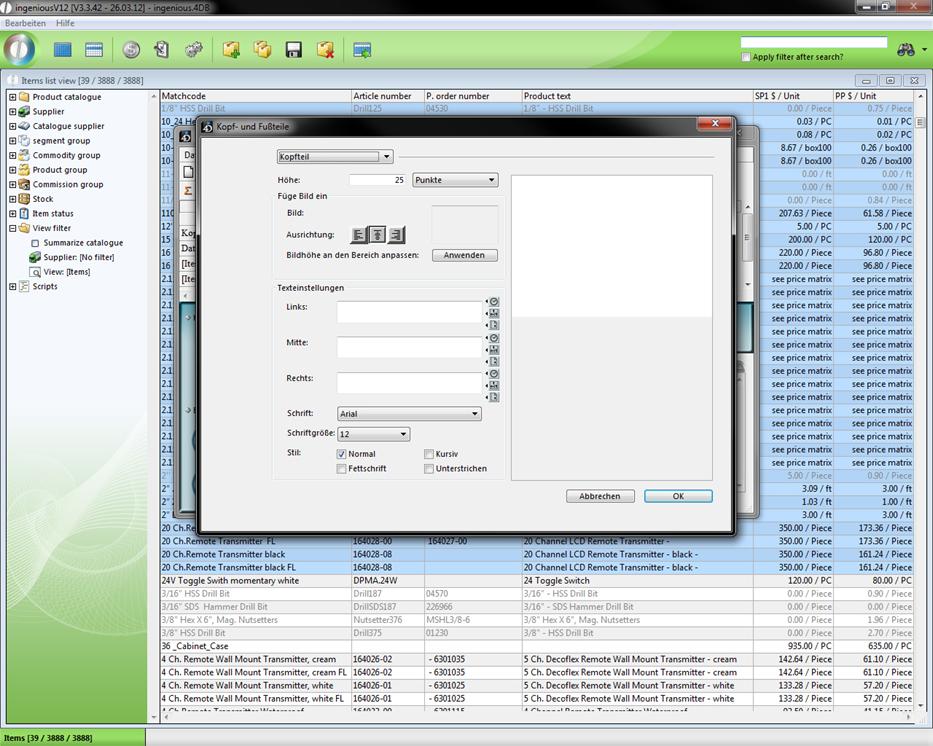
Window for creating a header and footer text
Borders and colors
By decorating the report with colors or borders, one can guide the viewer’s focus. Therefore, the quick report editor also offers numerous variations here. In order to set a frame, you must mark the respective cells and select the menu entry “Style / Borders …” afterwards. Here you can place the border with different thicknesses and colors in different positions.
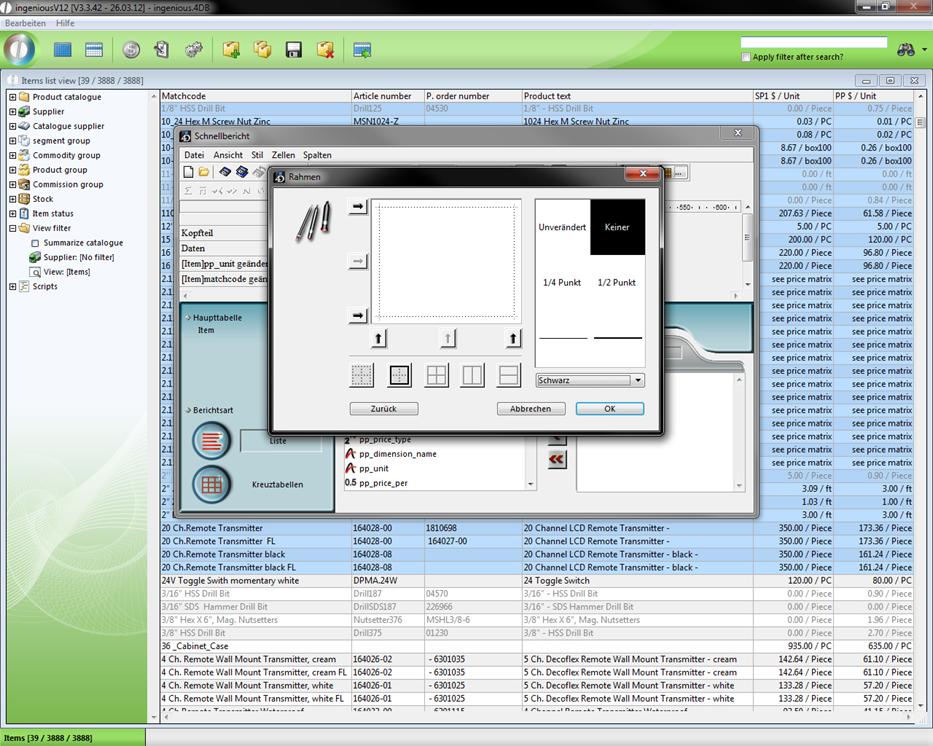
View of the “Borders” window
You can determine the colors of single cells or their contents with the context entry “Font color” for the respective cell or with the ![]() and
and ![]() buttons.
buttons.
The sorting sequence
You can change the sorting sequence in the area with the same name of the report characteristics.
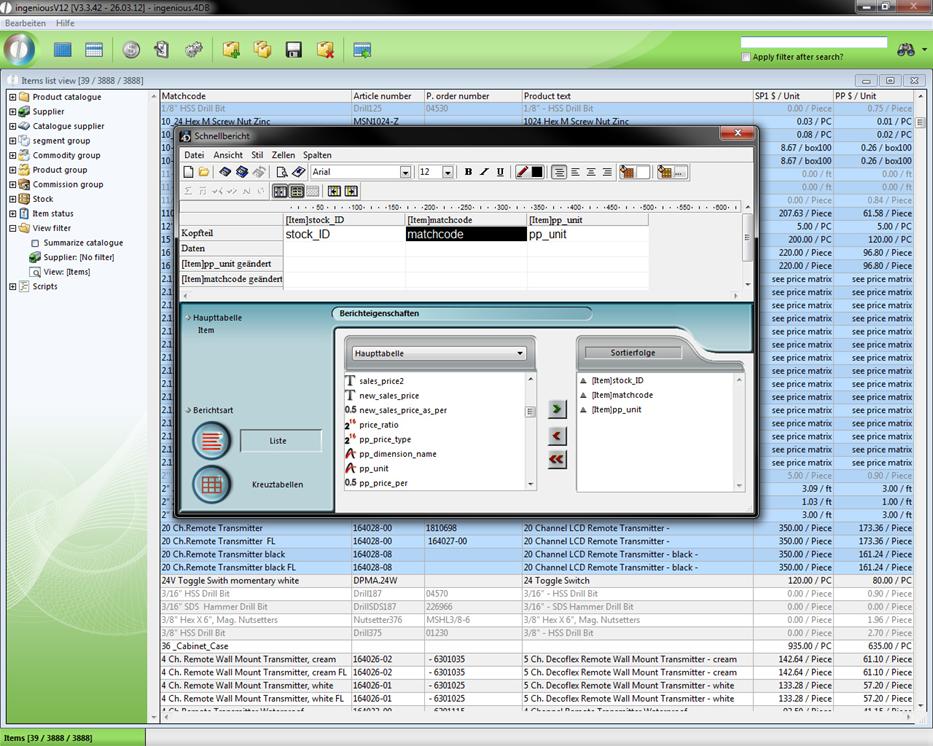
With a list as a quick report, the sorting occurs by means of the small triangle next to the data source. If the triangle points upwards (![]() ), it is sorted in ascending order (1,2.3, … or a, b, c, …). If the triangle points downward (
), it is sorted in ascending order (1,2.3, … or a, b, c, …). If the triangle points downward (![]() ), it is sorted in descending order.
), it is sorted in descending order.
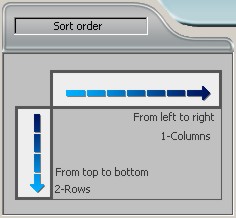
With a cross tab, the sorting occurs with blue arrows that run vertically and horizontally.
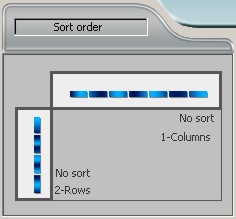
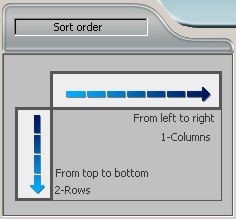
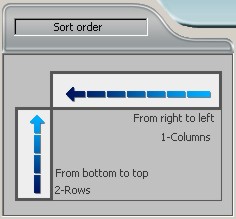
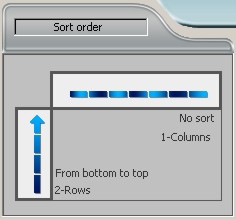
Some possibilities for sorting a cross tab
If you click on them, change your direction and therefore also the sorting sequence of the respective data source.
Standard calculations are used in cells of the quick report editor to determine numerical values. Standard calculations include “Sum”, “Average”, “Max”, “Min” and “Count”.
Sum
Adds the fixed (numerical) values with the cell and provides this sum in the same cell.
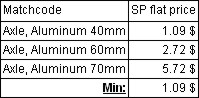
Min
Searches the lowest value of the fixed records with the cell (must be numeric) and returns it.
Max
Gives the highest value of the fixed records with the cell (must be numeric) and returns it.

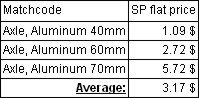
Average
Determines and provides the average of the fixed records with the cell (must be numerical).
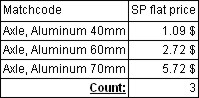
Count
Identifies the number of fixed records with the cell and provides them as a number. In contrast to the other standard calculations, the records in “Count” can be alphanumeric.
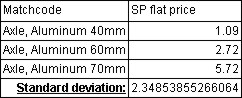
Standard deviation
This function helps you to calculate the average mean variation.
You can create completely individual columns with the formula editor. It is therefore possible to combine more data sources into one column. A simple exercise also follows in relation to this. In addition, you have the possibility to include even complex invoices and/or formulas in a table calculation.
Practice with the formula editor
-
In the article catalogue, mark all articles that begin with “Super Maxi Rail” and open the quick report editor.
-
Enter the formula editor (as shown below) with the help of the top button “Add…” and the data source selection field and confirm with “OK”.
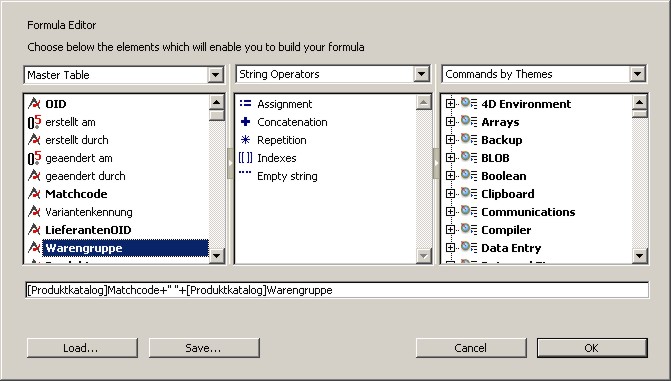
-
In the column head of the column, enter “Matchcode + Commodity group” and select the other columns as shown in the picture.
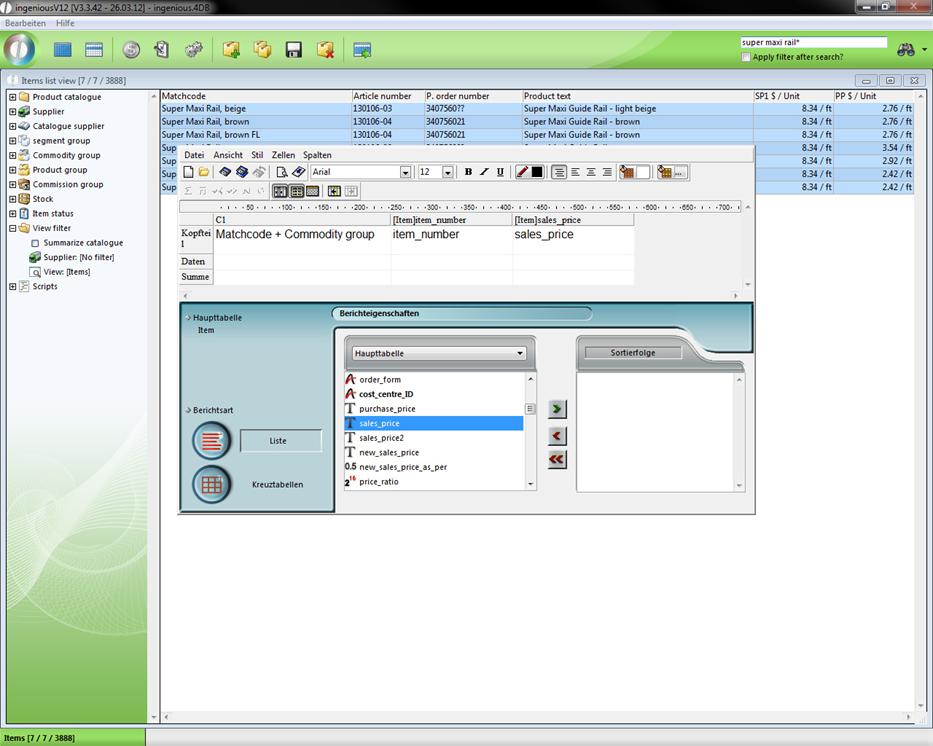
-
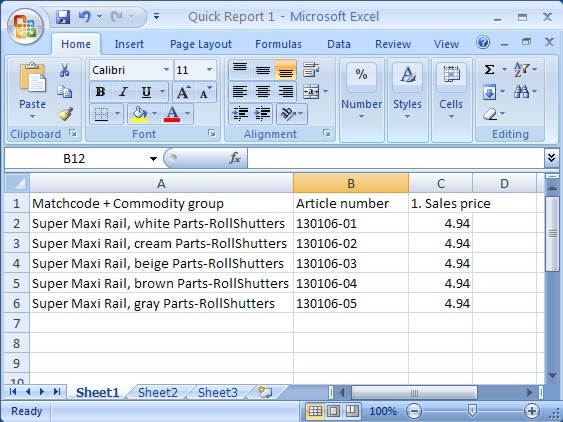
If you now create the text document as usual and generate it in an excel spreadsheet, you will reach the following result.
In this mode, the records are arranged according to different data sources and/or sorted and listed together. The cross tab shows your report as a two-dimensional table. The difference with the list table lies in the fact that your records result from exactly two data sources.
Practice creating a list
-
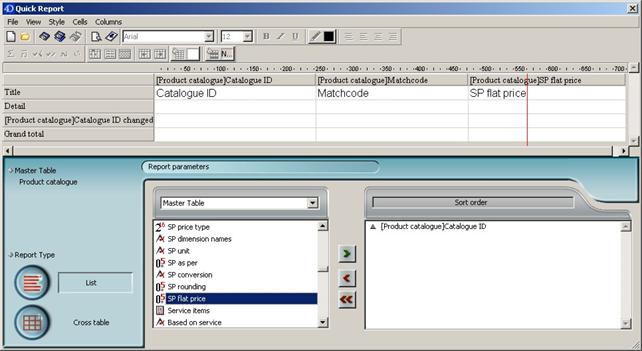
In the “Article” module, highlight at least six well-chosen articles and open the quick report editor.
-
Enter the data source “Catalogue ID”, “Matchcode” and “SP flate price” successively using Drag & Drop in the report section of the editor. Now the list should be sorted according to the data source “Catalogue ID”.
-
In addition, highlight “Catalogue ID” and pull it either by Drag & Drop or with the help of the button in the “Sort order” area.
-
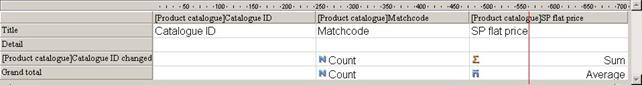
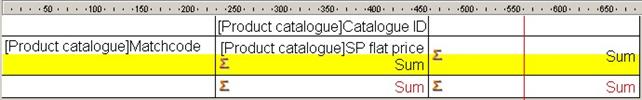
Click in the column “[Product catalogue] Matchcode” on the cell of the “Sum” line and select the pop-up menu entry (right mouse key) “Number” here. Repeat the process in the “[Product catalogue] Catalogue ID changed” line in the same column.
-
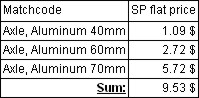
Explain step 4 again in the column “[Product catalog] SP flat price” in the line “[Product catalogue] Catalogue ID changed” with the pop-up menu entry “Sum” and in the line “Sum” once more with the context entry “Average”. This right justifies all cells except the header.
-
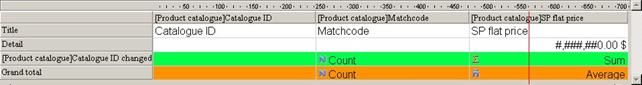
In the column “[Product catalog] SP flate price” change the format to #,###,##0.00 $ in the “File” line with the context menu. Change the appearance of the cells with the tools and menu bar or the pop-up menu of the respective cells.
-
With the right mouse click on the column head “[Product catalog] Catalogue ID” and deactivate the entry “Repeated values” from the context menu in order to delete the duplicate stock descriptions.
-
With the menu entry “File / Destination” select the option “Printer” to determine if the quick report should be printed out. Save the quick report with the menu item “File / Save as …” in any path.
-
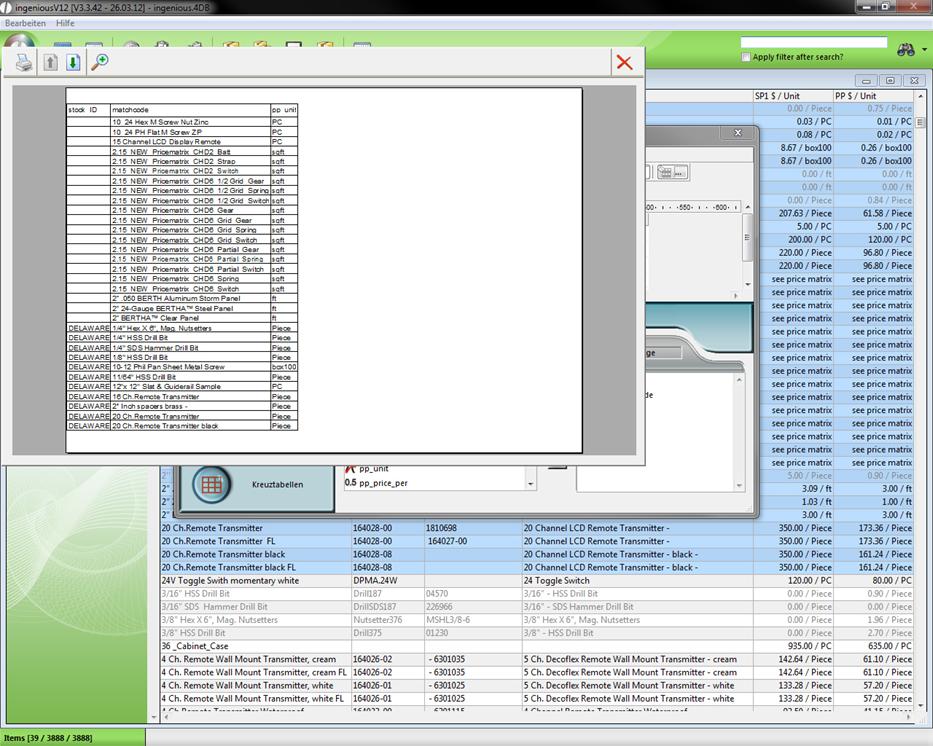
You receive a preview about your quick report with the button or the menu entry “File / Print Preview …”
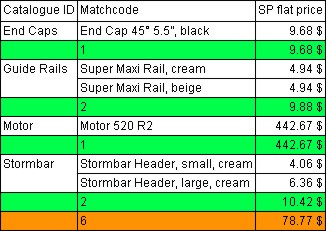
Print preview of a sample report
-
In order to generate the quick report (to print out in this case), just a click on the menu item “File / Generate …” is necessary and the printout is generated in a few seconds.
Practice creating a cross tab
-
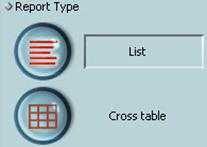
Mark at least six of any articles and open the quick report editor. Choose the report type “Cross tab”.
-
Now pull the entry (data source) “Catalogue ID” in the middle cell of the first line, and the second data source “Matchcode” in the middle line of the first column.
-
Expand the cross tab further (as shown below) with the record “SP flate price” and the standard calculation “Sum” (4x). With the context menu choose the format ###,##0.00 for all four inside cells.
-
By clicking on the blue arrows, one can change the sort sequence of the data source in a cross tab.
-
Mark the three cells of the middle line successively and select any alternative background color with the color menu.
-
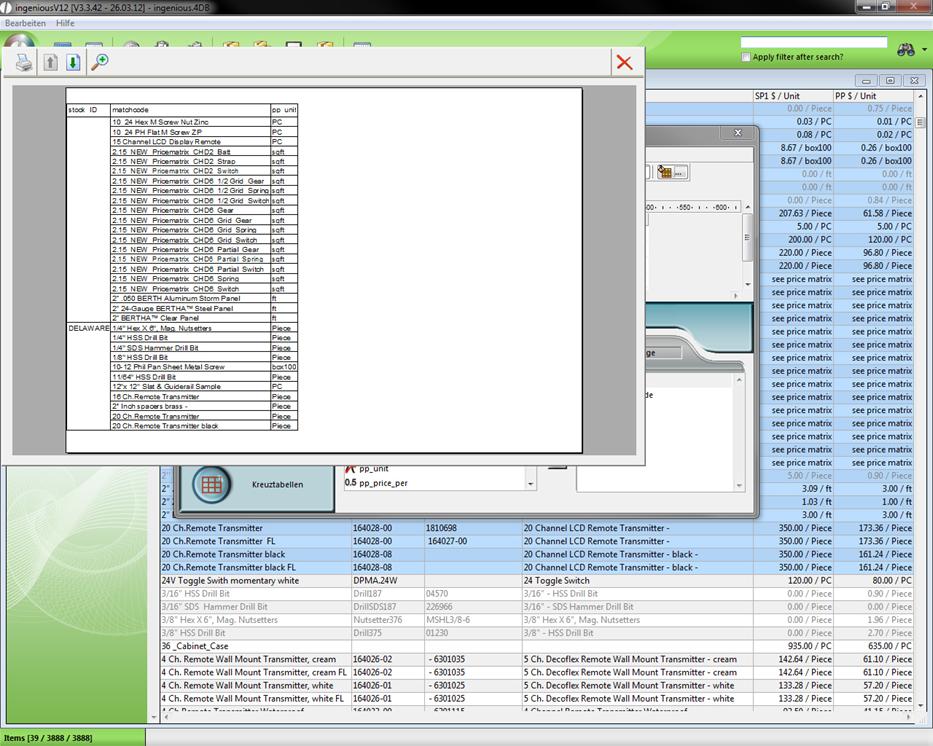
Choose the printer as the print target and save the quick report as usual (see practice with the list table) to look at the preview with the button afterwards.
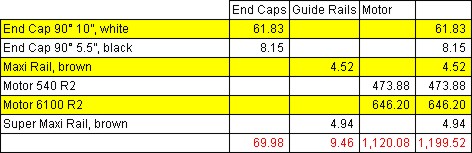
Print preview of a sample quick report
-
In order to get the quick report printed out now, you must select the menu entry “File / Create …”.
-
Further descriptions and examples can be found at the 4D documentation center:
http://doc.4d.com/4Dv12/4D/12.4/Quick-reports.200-1015827.en.html